JavaScript HTML CSS d3.js
February 2019 - March 2019
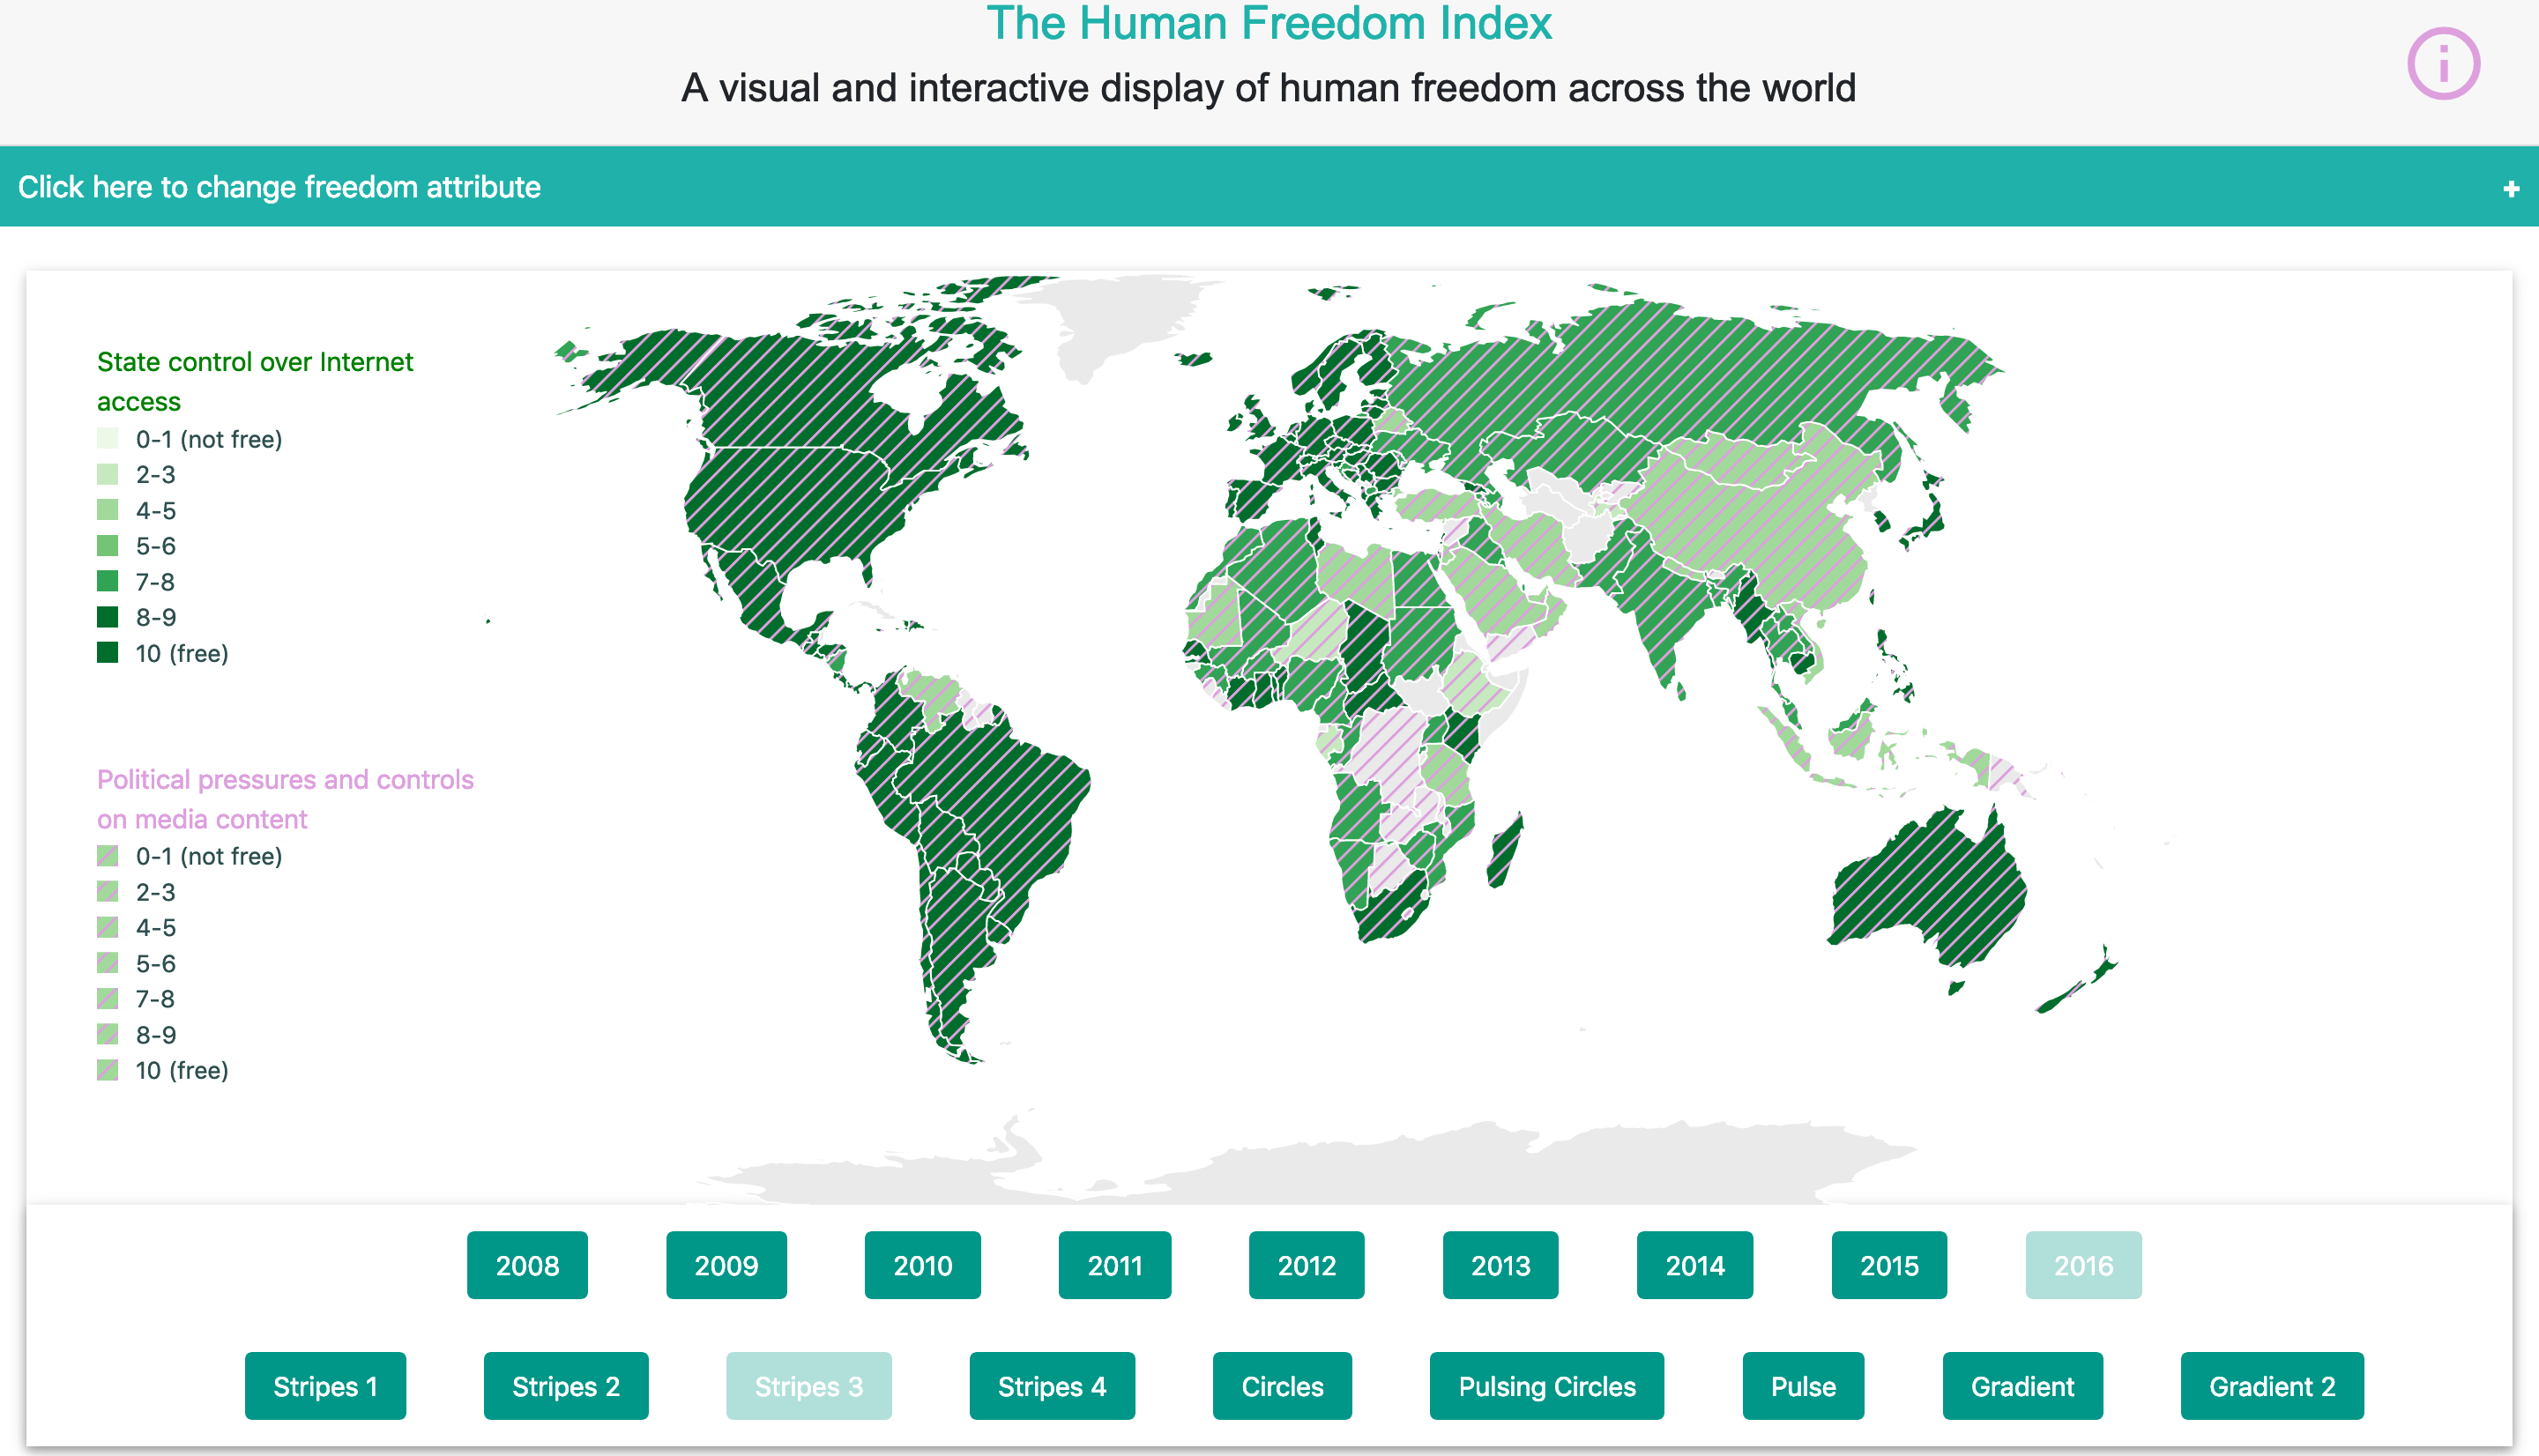
I worked on this project in a group of 3 students in the master course Information Visualization. The project consisted of the experimental process of creating a visualization of geospatial multivariate data using animations. A common problem with information visualization is to visualize multivariate data. My group wanted to test if animations or patterns could be used in an intuitive way to visualize multiple variables in a way that is also user friendly.
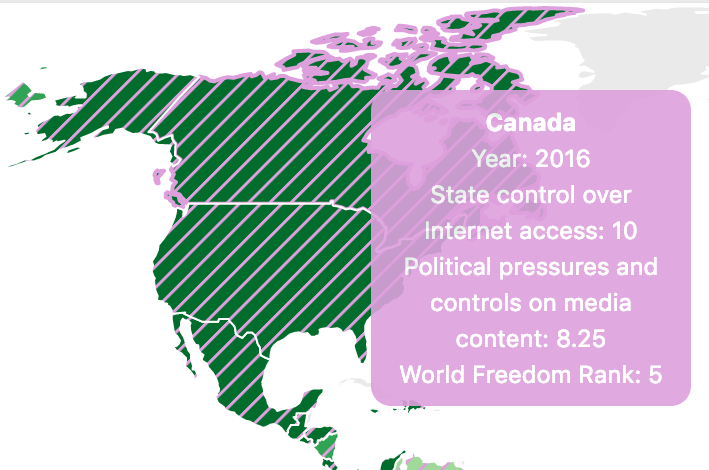
Different types of animations and patterns were implemented and combined with simple colour scale visualizations. The data set used is The Human Freedom Index’s data set. It is a comprehensive global measurement of human freedom collected from 162 countries around the world. The data set contains 79 different categories as indicators of personal, civil and economic freedom. Each category has an index that ranges between the values 0 to 10, where the lower the value the lesser freedom and vice versa.
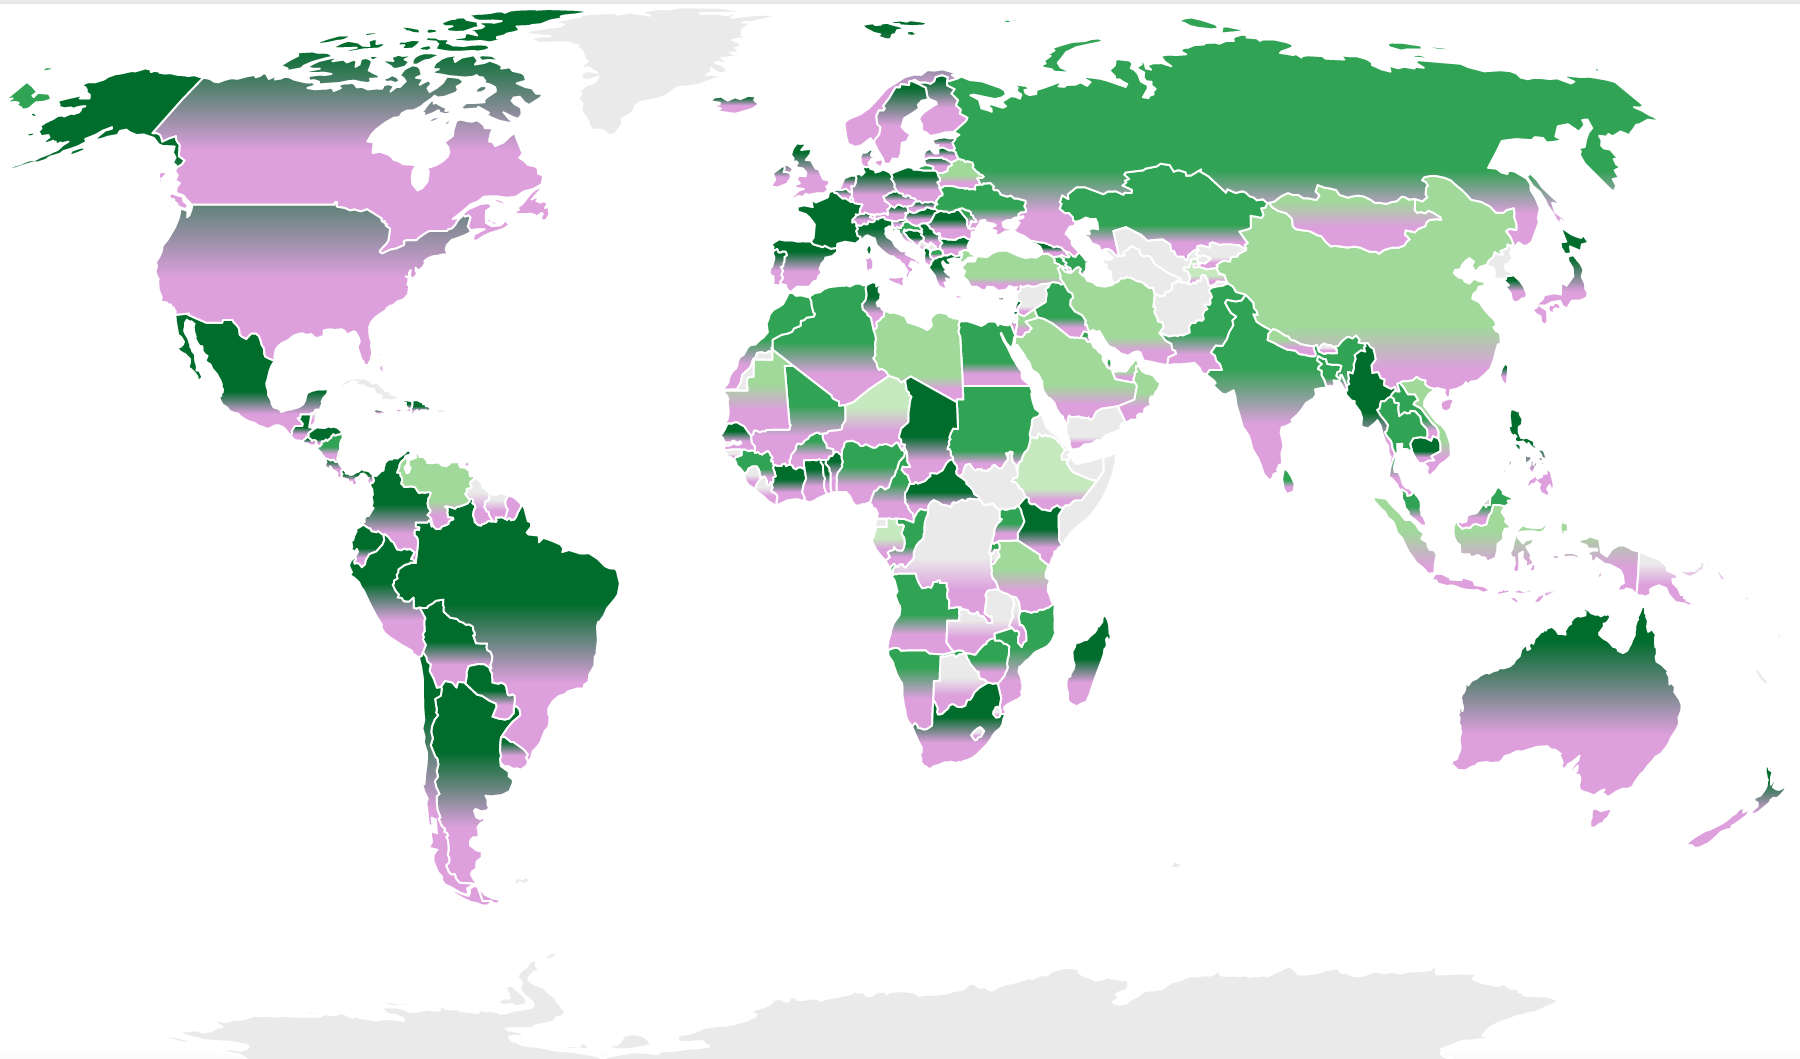
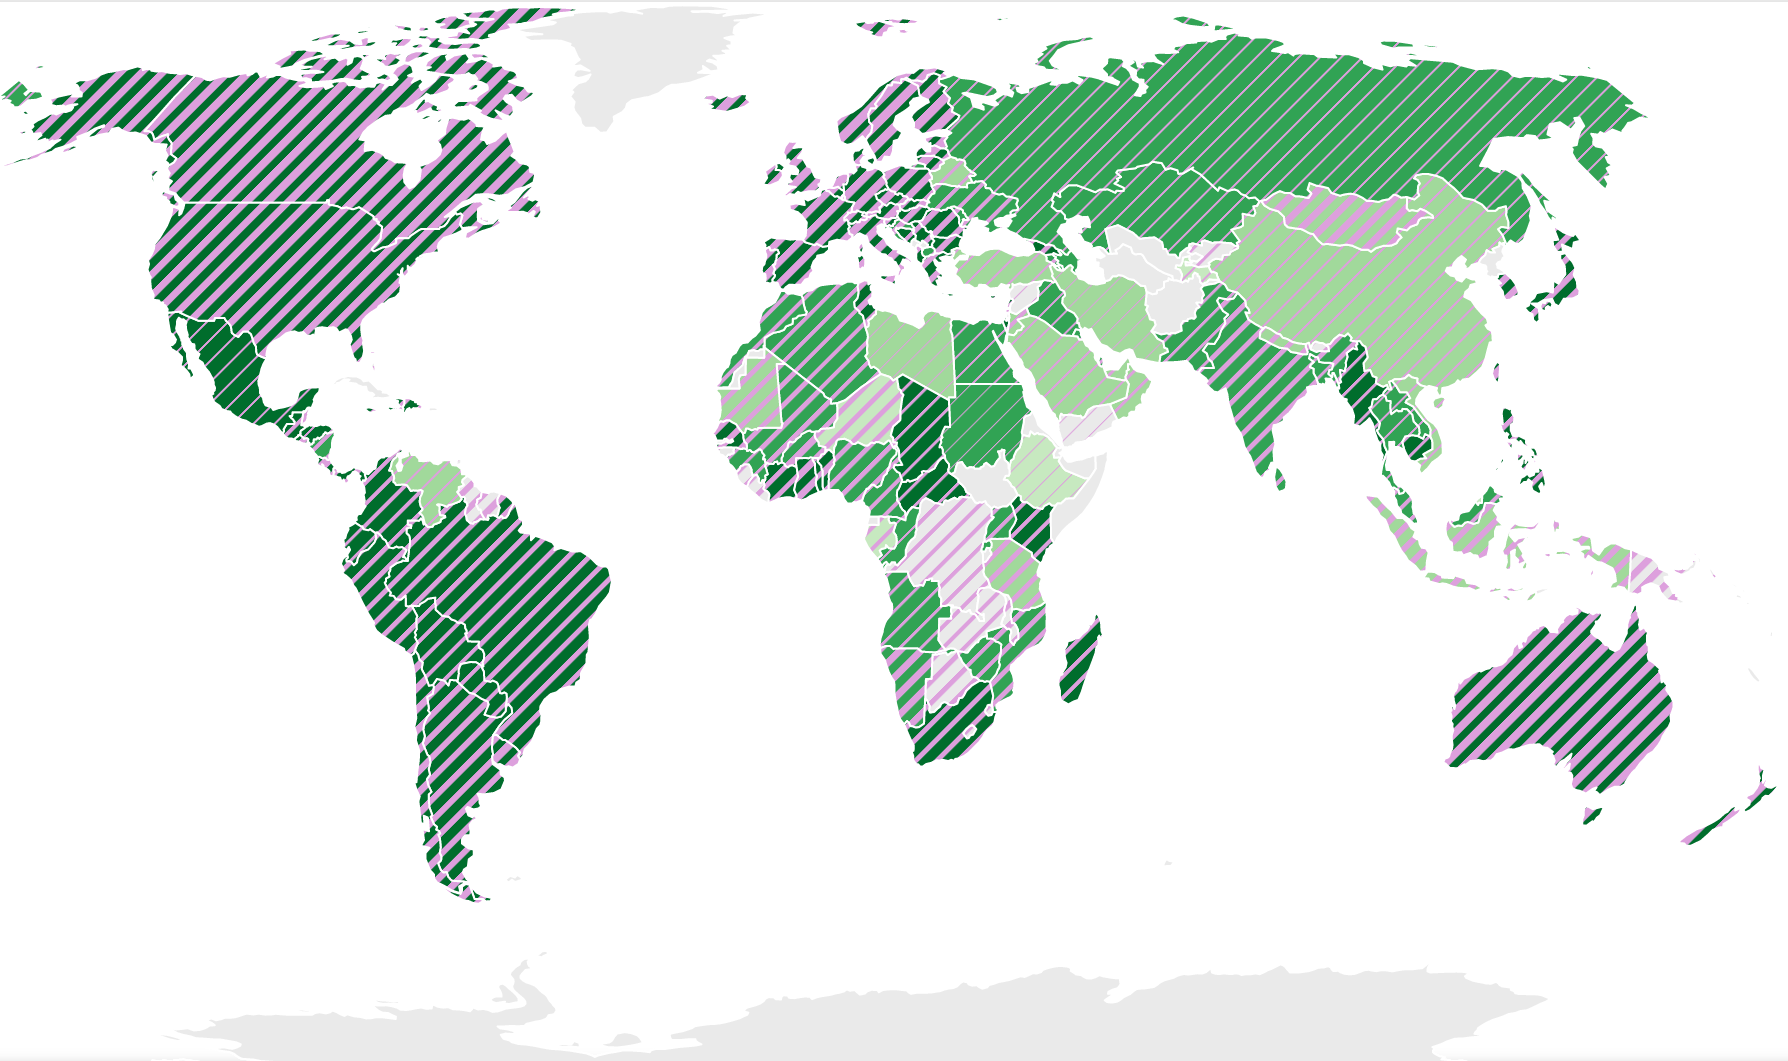
The implementation was in the form of a web application, using JavaScript 6, HTML and CSS. The javascript library d3.js was used to manipulate the visualizations based on the data, this was done with the help of SVG. The world map was set to an SVG element and by using d3’s .attr() the countries could be filled with textures by the SVG path fill attribute. To fill the countries with animated textures, JavaScript and the SVG elements animate and animateTransfrom were used. The end product is an interactive web application displaying an animated geovisualization. It was concluded that animations can show multivariate data by either alternating between two visualizations or by being used as an attribute.